Every developer eventually hits the same wall: the code compiles, it runs, and it produces the wrong answer — or crashes — and staring at the source code isn’t enough to figure out why. The instinct most beginners reach for is sprinkling print statements everywhere and re-running the program over and over, hoping to narrow down where things go wrong. It works, eventually, but it’s slow, and it stops working entirely once the bug only shows up under specific runtime conditions you can’t easily reproduce by re-reading code.
A debugger is the tool built to solve exactly this problem. It lets you pause a running program at a specific point, look at the actual values every variable holds at that moment, and step through your code one line at a time to watch precisely how it behaves — instead of guessing from the outside. On July 13, 2026, JetBrains shipped a full debugger for VS Code-compatible AI-native editors like Cursor for the first time (see our companion article, ReSharper VS Code Debugger: JetBrains’ Critical 2026.2 Release) — a reminder that even as AI coding assistants get better at writing code, actually inspecting a running program remains a distinct, essential skill no AI assistant replaces.
This guide explains what a debugger actually is, how it works under the hood, why it’s a fundamentally different kind of tool than an AI coding assistant, and how to use one effectively.
What Is a Debugger?
A debugger is a software tool that lets a developer control and inspect a running program — pausing its execution, examining the current values of variables and memory, and stepping through code one instruction or line at a time — instead of only reading the program’s source code or its final output.
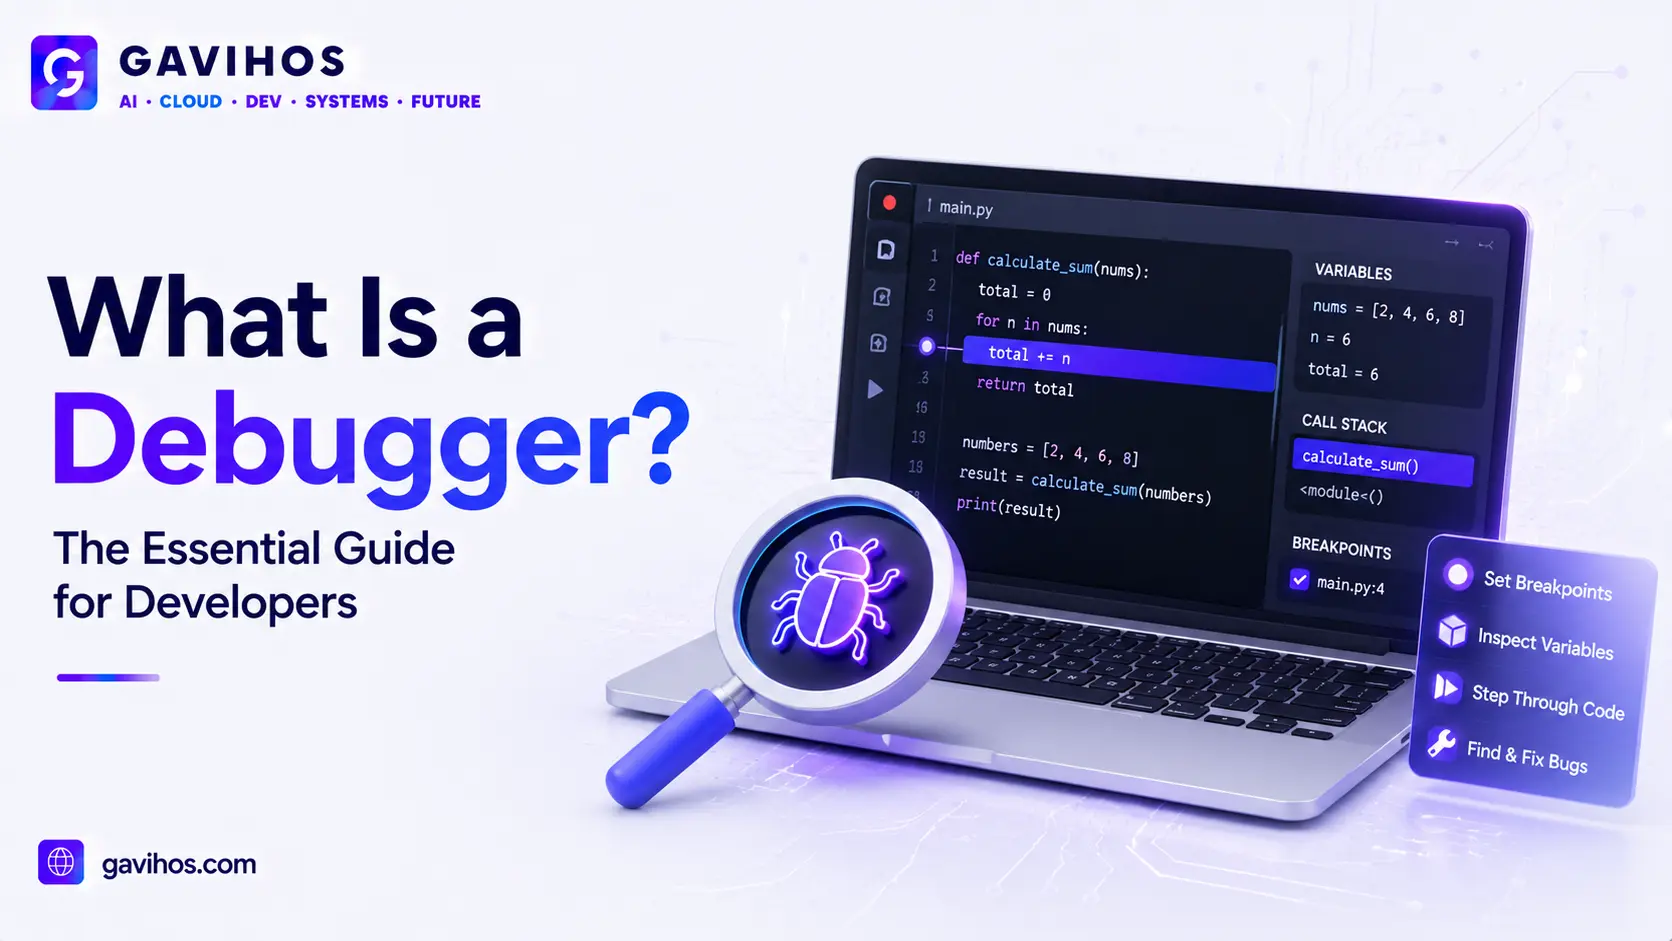
The core capability every debugger provides is the breakpoint: a marker you place on a specific line of code that tells the program “pause here.” When execution reaches that line, the program freezes exactly at that point, and the debugger shows you the current call stack (which functions called which other functions to get here), the current values of every variable in scope, and lets you continue execution one line at a time to watch exactly what happens next.
This is fundamentally different from logging or print statements, which only show you what you decided in advance to record. A debugger lets you inspect anything, at the exact moment of failure, without having to predict beforehand what information you’ll need — which is precisely why it becomes essential once a bug is subtle enough that print statements can’t easily catch it.
Why Does It Matter?
Business impact. Bugs that reach production cost real money — lost transactions, damaged trust, engineering hours spent firefighting instead of building. A developer who can efficiently pinpoint the root cause of a defect using a debugger resolves incidents faster than one relying purely on print statements and guesswork, which directly translates into less downtime and lower incident-response cost.
Technology impact. Debugging capability shapes which tools developers are willing to adopt for serious work. A code editor without proper debugging support is fine for quick scripts, but professional development teams generally won’t fully commit to a tool that can’t let them inspect a running program — which is exactly the gap JetBrains’ new VS Code-compatible debugger closes for .NET developers using AI-native editors.
Industry impact. As software systems grow more complex — distributed services, asynchronous code, AI agents making autonomous decisions — the value of being able to pause and inspect actual runtime state, rather than reasoning purely from source code, only grows. Debugging isn’t a beginner skill you outgrow; it becomes more valuable as systems get harder to reason about statically.
Why Now?
Debuggers aren’t new — they’ve existed since the earliest days of software development, in various forms, since the 1950s. What’s changed recently is where developers expect debugging to be available, and why that expectation has shifted.
AI-native code editors created a new category of tool that initially lacked full debugging support. Editors like Cursor built their early reputation on AI-assisted code generation and editing, and debugging support — a mature, technically demanding feature to build well — often lagged behind. As these tools have matured into serious daily-driver editors rather than novelty AI add-ons, the absence of proper debugging became a real, specific gap rather than a minor rough edge.
AI coding assistants have changed what kind of bugs developers actually encounter. AI-generated code can look plausible while containing subtle logical errors that aren’t obvious from reading it — the code compiles and resembles correct code, but the actual runtime behavior diverges from what the developer intended. This makes runtime inspection, not just code review, more important than it might have been when developers wrote every line themselves and had a clearer mental model of what should happen.
Vendors are now explicitly building debugging support for AI-native editors, closing the gap. JetBrains’ July 2026 release of a full .NET debugger for VS Code-compatible editors — including AI-native tools like Cursor — is a direct response to this shift, treating debugging support in AI-native editors as a serious, addressable market need rather than an afterthought.
How It Works
Trace what actually happens when you use a debugger to find a bug.
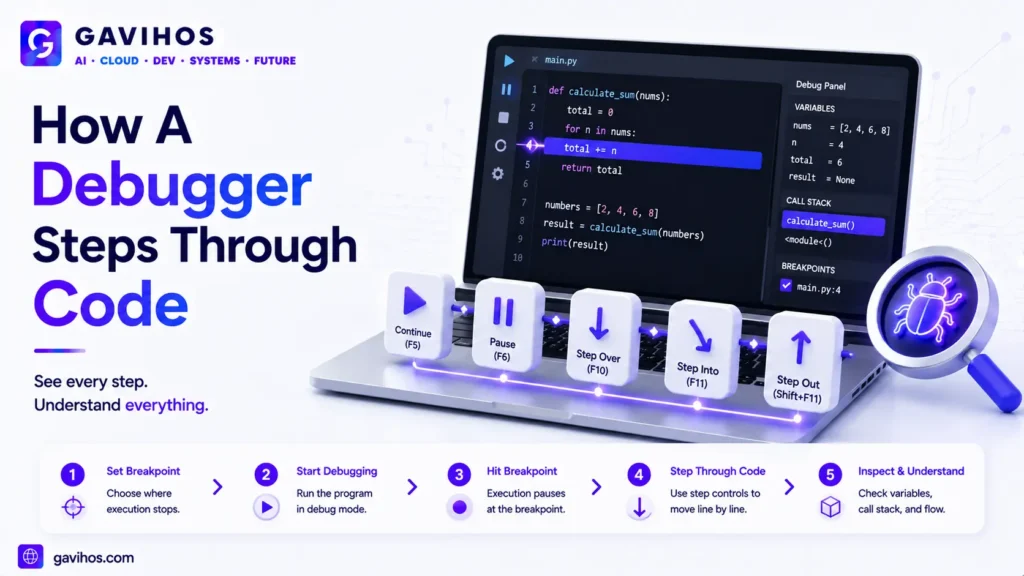
- You set a breakpoint. You mark a specific line in your code — typically right before or inside the section you suspect is misbehaving — telling the debugger to pause execution when that line is reached.
- You run the program under the debugger. Instead of running normally, the program starts under the debugger’s control, which can intercept and pause execution at any breakpoint.
- Execution reaches the breakpoint and pauses. The program freezes exactly at that line, before it executes. Nothing else runs until you tell the debugger to continue.
- You inspect the current state. The debugger shows you the call stack (the chain of function calls that led here) and the current value of every variable in scope — the actual runtime state, not what you assumed it would be.
- You step through execution. Using “step over” (execute this line and move to the next), “step into” (follow execution into a function call), or “step out” (finish the current function and return to its caller), you advance execution one controlled step at a time, watching how variables change.
- You identify the divergence. At some point, a variable holds a value you didn’t expect, or execution takes a branch you didn’t anticipate — that’s the moment you’ve found where your mental model of the code diverges from what it’s actually doing.
Conditional breakpoints (which only pause when a specified condition is true) and logpoints (which log a message instead of pausing) extend this same core mechanism for situations where pausing on every single hit of a line would be too disruptive — for example, a loop that runs thousands of times where you only care about one specific iteration.
Architecture / Components
| Component | Role | Why It Matters |
|---|---|---|
| Breakpoint | Marks a line where execution should pause | The fundamental unit of control a debugger gives you over a running program |
| Call stack | Shows the chain of function calls leading to the current point | Tells you not just where you are, but how you got there |
| Variable inspector | Displays current values of variables in scope | Reveals actual runtime state instead of assumed state |
| Step controls (over/into/out) | Let you advance execution in controlled increments | Lets you watch behavior unfold rather than jumping straight to the end result |
| Conditional breakpoints / logpoints | Extend breakpoints to trigger only under specific conditions, or log instead of pause | Make debugging practical in loops and high-frequency code paths |
| Debug adapter (in modern editors) | Connects the editor’s UI to the actual language runtime being debugged | Lets one editor UI support debugging across multiple languages and runtimes through a standard protocol |
Core workflow: the editor’s debugging UI communicates with a debug adapter, which in turn controls the actual running process (or an emulated/remote version of it), relaying breakpoint hits, variable state, and step commands back and forth — this separation is what lets a single editor like VS Code support debugging for dozens of different languages and runtimes through a standardized protocol rather than building custom debugging logic for each one.
Real World Use Cases
- Diagnosing a logic bug that print statements can’t easily catch. A calculation produces a subtly wrong result under specific input conditions; stepping through with a debugger reveals exactly which line first computes the wrong value.
- Investigating a crash at the exact point of failure. Attaching a debugger to a crashing process (or reproducing the crash under a debugger) shows the full call stack and variable state at the moment of failure, rather than just an error message after the fact.
- Understanding unfamiliar code by watching it run. Stepping through a codebase you didn’t write is often faster for building an accurate mental model than reading it statically, especially for complex control flow.
- Debugging AI-generated code that looks correct but behaves incorrectly. Code produced by an AI coding assistant can be syntactically clean and plausible while still containing subtle logic errors — a debugger reveals the actual runtime behavior regardless of how confident the code looks on the page.
- Reproducing and fixing intermittent bugs. Conditional breakpoints let developers pause only when a specific rare condition occurs (say, the 500th iteration of a loop, or a specific unusual input value), making otherwise hard-to-catch intermittent bugs tractable.
Benefits
- Reveals actual runtime state directly, instead of requiring developers to predict in advance what information they’ll need (as print-statement debugging does).
- Dramatically speeds up diagnosis of subtle logic bugs that don’t produce an obvious error message.
- Builds an accurate mental model of unfamiliar code faster than static reading alone, especially for complex control flow.
- Scales to more complex debugging scenarios (conditional breakpoints, remote debugging, multi-process debugging) that print statements simply can’t handle well.
Limitations
- Debuggers add real overhead to learn well — effective use requires understanding breakpoints, stepping strategies, and how to read a call stack, which takes practice beyond basic familiarity.
- Some environments (heavily distributed systems, certain production environments) make attaching a debugger difficult or risky, limiting where this technique can be applied directly.
- Debugging highly concurrent or timing-sensitive code can be tricky, since pausing execution to inspect state can itself change the timing behavior that caused the original bug.
- A debugger shows you what’s happening, but not why your code was written that way — understanding intent still requires reading and reasoning about the code itself.
Engineering Tradeoffs
Learning to debug effectively improves diagnosis speed and reduces reliance on guesswork, but it requires a real, ongoing investment: understanding your specific debugger’s interface, building the habit of setting breakpoints strategically rather than randomly, and developing the judgment to know when stepping through code will actually be faster than reasoning about it statically.
What becomes harder in some contexts: debugging distributed systems, where the bug’s cause and its observable effect may be in different processes entirely, or debugging timing-sensitive concurrent code, where the act of pausing execution can itself mask or alter the bug you’re chasing. These situations often require complementary techniques — structured logging, distributed tracing — alongside or instead of a traditional line-by-line debugger.
This tradeoff is worth making for essentially all serious software development — the investment in learning to debug effectively pays for itself the first time it saves hours over guess-and-check print debugging. It’s least useful for extremely simple scripts where the entire program’s behavior is already obvious from reading it.
Best Practices
- Set breakpoints strategically, close to where you suspect the problem is, rather than scattering them broadly and hoping to stumble onto the issue.
- Use conditional breakpoints for bugs that only occur under specific conditions (a particular input value, a specific loop iteration) instead of manually clicking through irrelevant hits.
- Inspect the call stack, not just the current line — understanding how execution arrived at a point is often as important as the point itself.
- Use logpoints instead of breakpoints when you need to observe a value across many executions without interrupting program flow each time.
- Combine debugging with reading the code beforehand — a debugger tells you what’s happening, but forming a hypothesis first makes your investigation targeted instead of aimless.
Common Mistakes
- Reaching immediately for print statements out of habit, even when a debugger would find the issue faster, especially for anything beyond a trivial bug.
- Setting a breakpoint and then clicking “step over” repeatedly without a hypothesis, instead of thinking about where the divergence between expected and actual behavior is most likely to occur.
- Ignoring the call stack and only looking at local variable values, missing context about how the program actually reached the current state.
- Assuming a debugger isn’t available or worth setting up for a “quick” bug, then spending far longer manually tracing the issue than setting up a debugging session would have taken.
What Most People Get Wrong
“Debugging is a beginner skill you outgrow.” In reality, debugging skill becomes more valuable, not less, as systems grow more complex — distributed services, concurrent code, and AI-generated code all present debugging challenges that experienced engineers spend real time developing judgment around, not just newcomers.
“An AI coding assistant makes debuggers less necessary.” The two solve different problems. An AI assistant helps generate or explain code; a debugger reveals what code actually does at runtime — and AI-generated code specifically can look plausible while still containing errors only visible by actually running and inspecting it.
“Print statements and debuggers accomplish the same thing, just with different syntax.” Print debugging requires deciding in advance what to record; a debugger lets you inspect anything, on demand, at the exact moment of failure — a meaningfully more flexible and often faster approach once a bug is subtle.
“If my editor doesn’t have a built-in debugger, I can’t really debug in it.” This was a real limitation until recently for some AI-native editors, but as tooling vendors like JetBrains extend debugging support into these editors, the gap is closing quickly — see our companion article on JetBrains’ new VS Code-compatible debugger for a concrete example.
Future Outlook
Expect debugging support to keep closing as a feature gap across AI-native code editors, as tooling vendors increasingly treat these editors as serious daily-driver tools worth building full debugging capability for, rather than lightweight AI-assistance add-ons.
Expect debugging techniques to keep evolving alongside AI-generated code specifically, since the failure modes of AI-written code (plausible-looking but subtly wrong logic) differ somewhat from the failure modes of hand-written code, potentially shaping new debugger features tuned to that pattern.
Expect debugging to remain a durable, non-automatable skill even as AI coding assistants improve, since inspecting actual runtime behavior — as opposed to predicting or explaining code statically — is a fundamentally different task that current AI coding tools don’t replace.
FAQ
1. What is a debugger? A debugger is a software tool that lets a developer pause a running program at a specific point, inspect the current values of variables and the call stack, and step through code one line at a time to observe exactly how it behaves.
2. How is a debugger different from print statement debugging? Print statements only show information you decided in advance to record. A debugger lets you inspect any variable or program state on demand, at the exact moment of failure, without predicting beforehand what you’ll need to see.
3. What is a breakpoint? A breakpoint is a marker placed on a specific line of code that tells the debugger to pause program execution when that line is reached, so you can inspect the program’s current state.
4. What’s the difference between “step over,” “step into,” and “step out”? “Step over” executes the current line and moves to the next without following any function calls it makes. “Step into” follows execution into a called function. “Step out” finishes the current function and returns control to whatever called it.
5. What is a conditional breakpoint? A conditional breakpoint only pauses execution when a specified condition is true, useful for bugs that only occur under specific circumstances, like a particular input value or a specific loop iteration.
6. Can I debug AI-generated code the same way as code I wrote myself? Yes — the debugging process is identical regardless of who or what wrote the code. It’s arguably more useful for AI-generated code, since that code can look plausible while still containing subtle logic errors not obvious from reading it.
7. Do AI-native code editors like Cursor support debugging? Support has historically varied and lagged behind traditional IDEs for some languages, but this is actively improving — JetBrains’ July 2026 release of a full .NET debugger for VS Code-compatible AI-native editors is a concrete recent example of this gap closing.
8. Is learning to use a debugger difficult? The basic workflow — setting a breakpoint, running under the debugger, stepping through code — is straightforward to learn. Developing good judgment about where to set breakpoints and how to interpret what you see takes ongoing practice, similar to any other core engineering skill.
9. Can debuggers be used on production systems? It depends on the environment — some production setups support careful, limited debugging (particularly for non-critical issues), while others make direct debugger attachment risky or impractical, in which case logging and tracing tools are often used instead.
10. Will AI eventually make debuggers unnecessary? Unlikely in any near-term sense. AI coding assistants help write and explain code, but a debugger’s core value — revealing actual runtime behavior rather than predicted behavior — addresses a different problem that isn’t solved by better code generation alone.
Analyst Perspective
The most important thing to understand about debuggers is that they remain one of the few genuinely irreplaceable tools in software development, even as AI reshapes almost everything else about how code gets written. AI coding assistants have gotten remarkably good at generating plausible code, but “plausible” and “correct” are different properties, and the gap between them is exactly where debuggers do their work — by showing you what a program actually does, not what it looks like it should do.
The hidden implication worth watching is that AI-generated code may actually be increasing the practical value of debugging skill, not decreasing it. Code a developer writes themselves usually comes with some intuition about likely failure points, built from having reasoned through the logic while writing it. Code generated by an AI assistant often lacks that intuition for the developer reviewing it — which makes the ability to pause, inspect, and step through that code at runtime more valuable, not less, as a larger share of a codebase is written by AI tools.
For developers and engineering teams, the practical takeaway is to treat debugging proficiency as a durable investment rather than a beginner-level skill to move past quickly. As AI-native editors continue closing debugging feature gaps — as JetBrains’ new VS Code-compatible debugger demonstrates — there’s less and less reason to accept a tool that can’t give you this capability, and more reason to actually build strong debugging habits once it’s available everywhere you work.
Key Takeaways
- A debugger lets you pause a running program, inspect variable values and the call stack, and step through code line by line — revealing actual runtime behavior instead of requiring you to guess from source code alone.
- Breakpoints are the fundamental control mechanism; conditional breakpoints and logpoints extend that mechanism for high-frequency or condition-specific scenarios.
- Debugging is fundamentally different from print-statement debugging, which only shows information decided on in advance rather than allowing on-demand inspection of anything at the moment of failure.
- AI-native code editors historically lagged in debugging support, but tooling vendors are actively closing that gap — JetBrains’ July 2026 VS Code-compatible .NET debugger is a concrete recent example.
- AI coding assistants don’t replace debuggers — they solve a different problem (generating/explaining code vs. revealing actual runtime behavior), and AI-generated code’s plausible-but-subtly-wrong failure mode arguably makes debugging skill more valuable, not less.
- Debugging proficiency is a durable, non-automatable skill worth investing in continuously, not a beginner-level capability developers outgrow.
Continue Learning
- ReSharper VS Code Debugger: JetBrains’ Critical 2026.2 Release
- GitHub Copilot Agent Mode: Autonomous Multi-Step Coding Tasks Now Available in VS Code
- SpaceX Acquires Cursor for $60 Billion: What It Means for AI Coding Tools and Developers
- What Is Remote Code Execution (RCE)? Complete Guide
- What Are AI Agents? Architecture, Memory, Tools and Real-World Use Cases
About GAVIHOS
GAVIHOS helps developers, founders and technology enthusiasts understand AI, software engineering and emerging technologies through practical guides, tutorials and industry analysis.
Stay Updated
Follow GAVIHOS for practical AI, technology and developer-focused insights.
External Links
| Source | URL |
|---|---|
| Microsoft — Debug Adapter Protocol Overview | https://microsoft.github.io/debug-adapter-protocol/ |
| JetBrains .NET Tools Blog — New Debugger for VS Code-Compatible Editors | https://blog.jetbrains.com/dotnet/2026/07/13/rs-vsc-debugging/ |
| Visual Studio Code Documentation — Debugging | https://code.visualstudio.com/docs/editor/debugging |